import numpy as np
import matplotlib.pyplot as plt
from matplotlib.colors import LogNorm, LinearSegmentedColormap, Normalize, SymLogNorm
from matplotlib import cm as colormap
from matplotlib import animation, collections
import time
from string import ascii_lowercase

# SimPEG, discretize
import discretize
from discretize import utils
from simpeg.electromagnetics import time_domain as tdem
from simpeg.electromagnetics import resistivity as dc
from simpeg.utils import mkvc, plot_1d_layer_model
from simpeg import (
    maps,
    data,
    data_misfit,
    inverse_problem,
    regularization,
    optimization,
    directives,
    inversion,
    utils,
    Report
)
from simpeg import electromagneticsSolver = utils.solver_utils.get_default_solver()csx = 100
csz = 50
scale = 1400
ncx = int(np.ceil(scale/csx))
ncz = int(np.ceil(scale/csx))
nca = 1
npadx = 12
npadz = 14
pf = 1.45
mesh = discretize.TensorMesh(
[
[(csx, npadx, -pf), (csx, ncx), (csx, npadx, pf)],
[(csx, npadx, -pf), (csx, ncx), (csx, npadx, pf)],
[(csz, npadz, -pf), (csz, ncz+nca), (csz, npadz, pf)]
],
origin = "CC0"
)
mesh.origin = mesh.origin + np.r_[0, 0, -mesh.h[2][:npadz+ncz].sum()]
mesh.plot_grid()<Axes3D: xlabel='x1', ylabel='x2', zlabel='x3'>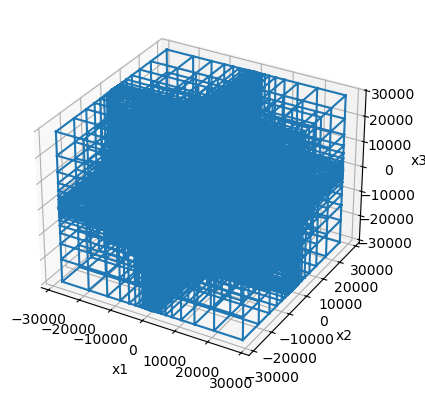
mesh
  TensorMesh: 62,092 cells

                      MESH EXTENT             CELL WIDTH      FACTOR
  dir    nC        min           max         min       max      max
  ---   ---  ---------------------------  ------------------  ------
   x     38    -28,211.51     28,211.51    100.00  8,638.06    1.45
   y     38    -28,211.51     28,211.51    100.00  8,638.06    1.45
   z     43    -29,799.10     29,149.10     50.00  9,080.76    1.45
rho_back = 1000
rho_layer = 20
rho_air = 1e8

slope_layer = -0.2
layer_b = -350
t_layer = 200

def z_layer_top(y):
    return np.min([np.zeros_like(y), slope_layer * y + layer_b], axis=0)

def z_layer_bottom(y):
    return np.min([np.zeros_like(y), z_layer_top(y) - t_layer], axis=0)

wire_length = 400

def diffusion_distance(sigma, t):
    return 1260 * np.sqrt(t/sigma)
rx_times = np.logspace(np.log10(1e-6), np.log10(8e-3), 20)
diffusion_distance(1./rho_back, 1e-3)np.float64(1260.0)resistivity_model = rho_air * np.ones(mesh.n_cells)
resistivity_model[mesh.cell_centers[:, 2] < 0] = rho_back
halfspace = resistivity_model.copy()
layer_x = np.r_[-600, 600]
inds_z_layer = (
(mesh.cell_centers[:, 0] >= layer_x.min()) &
(mesh.cell_centers[:, 0] <= layer_x.max()) &
(mesh.cell_centers[:, 2] >= z_layer_bottom(mesh.cell_centers[:, 0])) &
(mesh.cell_centers[:, 2] <= z_layer_top(mesh.cell_centers[:, 0]))
)
resistivity_model[inds_z_layer] = rho_layer
models = {
"target": resistivity_model,
"halfspace": halfspace
}np.unique(resistivity_model)array([2.e+01, 1.e+03, 1.e+08])fig, ax = plt.subplots(1, 1, figsize=(8, 4))
xlim = 800*np.r_[-1, 1]
zlim = np.r_[-1200, 200]
key = "target"
mesh.plot_slice(
1./models[key], ax=ax,
pcolor_opts={"norm":LogNorm(vmin=1./rho_air*1000, vmax=1./rho_layer)},
normal="Y",
grid=True,
grid_opts={"color":"k", "lw": 0.5}
)
ax.set_xlim(xlim)
ax.set_ylim(zlim)
ax.set_aspect(1)
plt.tight_layout()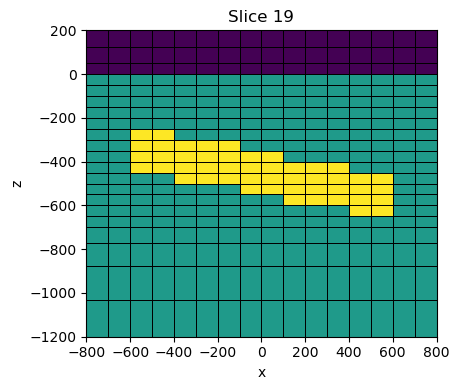
simulation
time_steps = [
    # (1e-4, np.floor(waveform.peak_time/1e-4)),
    # (1e-5, np.floor((waveform.off_time-waveform.peak_time)/1e-5)),
    (1e-6, 40), (3e-6, 40), (1e-5, 40), (3e-5, 50), #(1e-4, 5), #(3e-4, 10)
]
rx_times = np.cumsum(np.hstack([np.r_[0], discretize.utils.unpack_widths(time_steps)]))
rx_times.max()*1e3np.float64(2.060000000000003)fig, ax = plt.subplots(1, 1, figsize=(4, 1.5), dpi=150)
x = np.linspace(-rx_times.max()/10, rx_times.max()*1.05, 1000)
waveform = np.zeros_like(x)
waveform[x < 0] = 1
ax.plot(x*1e3, waveform, color="k")
ax.grid()
rx_times_plot = 1
ax.plot(rx_times[::rx_times_plot]*1e3, np.zeros_like(rx_times[::rx_times_plot]), "|", markeredgewidth=0.75, ms=10, color="C3", label="simulation times")
ax.set_ylim(np.r_[-0.25, 1.25])
ax.legend()
ax.set_ylabel("TX current")
ax.set_xlabel("time (ms)")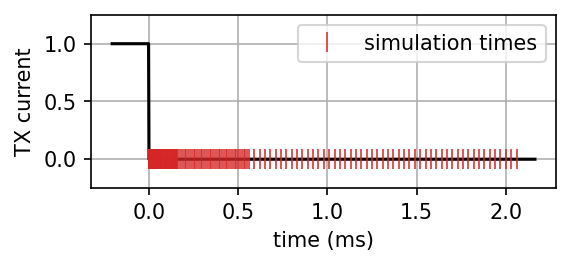
waveform=tdem.sources.StepOffWaveform()

rx_y = 500
rx_height = 0


rx_z = tdem.receivers.PointMagneticFluxTimeDerivative(
    np.r_[0, rx_y, rx_height], times=rx_times, orientation="z"
)

loop_src = tdem.sources.CircularLoop(
    radius = wire_length/2,
    receiver_list=[rx_z], waveform=waveform, moment=-1
    # srcType="inductive"
)

# loop_src = tdem.sources.LineCurrent(
#     location = np.array([
#         [-wire_length/2, -wire_length/2, 0],
#         [-wire_length/2, wire_length/2, 0],
#         [wire_length/2, wire_length/2, 0],
#         [wire_length/2, -wire_length/2, 0],
#         [-wire_length/2, -wire_length/2, 0],

#     ]),
#     receiver_list=[rx_z], waveform=waveform,
#     srcType="inductive"
# )

wire_src = tdem.sources.LineCurrent(
    location=np.array([
        [0, -wire_length, 0],
        [0, wire_length, 0],
    ]),
    receiver_list=[rx_z], waveform=waveform,
    srcType="galvanic"
)

survey = tdem.Survey([loop_src]) #, wire_src])
sim = tdem.simulation.Simulation3DElectricField(
mesh=mesh, survey=survey, time_steps=time_steps, solver=Solver,
rhoMap=maps.IdentityMap(mesh)
)fields = {}
dpred = {}
for key, val in models.items():
t = time.time()
fields[key] = sim.fields(val)
print(f"done fields {key}... {time.time() - t: 1.2e}s")
dpred[key] = sim.dpred(val, f=fields[key])
print(f"done dpred {key}... {time.time() - t: 1.2e}s")
/Users/lindseyjh/miniforge3/envs/py311/lib/python3.11/site-packages/pymatsolver/solvers.py:415: FutureWarning: In Future pymatsolver v0.4.0, passing a vector of shape (n, 1) to the solve method will return an array with shape (n, 1), instead of always returning a flattened array. This is to be consistent with numpy.linalg.solve broadcasting.
  return self.solve(val)
done fields target...  5.62e+01s
done dpred target...  5.66e+01s
done fields halfspace...  5.68e+01s
done dpred halfspace...  5.72e+01s
def plot_data(
    ti=None, key="target",src="loop", ax=None, xlim=np.r_[1e-2, 2], ylim=np.r_[1e-10, 1e-4]
):
    if ax is None:
        fig, ax = plt.subplots(1, 1, figsize=(4.5, 3.5))

    def plot_loglog(vals, color, label):
        neg_inds = vals < 1e-9
        neg_inds[0] = False
        ax.loglog(rx_times[neg_inds]*1e3, -vals[neg_inds], color, label=label)
        ax.loglog(rx_times[~neg_inds]*1e3, vals[~neg_inds], "--" + color)


    for i, key in enumerate(["halfspace", "target"]):
        if src == "loop":
            dpred_vals = dpred[key][:len(rx_times)]
        elif src == "wire":
            dpred_vals = dpred[key][len(rx_times):]
        plot_loglog(dpred_vals, f"C{i}", key)

    if ti is not None:
        ax.plot(sim.times[ti]*1e3*np.r_[1, 1], ylim, color="k", lw=1)
        # ax.plot(sim.times[ti]*1e3, -dpred["target"][ti], ".k", ms=8)

        time_label = (sim.times[ti]-waveform.off_time)*1e3
        if time_label > 0.99:
            ax.text(0.9, ylim.min()*1.2, f"t={time_label:1.1f} ms", fontsize=14, ha="right")
        else:
            ax.text(0.9, ylim.min()*1.2, f"t={time_label:1.2f} ms", fontsize=14, ha="right")

    ax.set_xlim(xlim)
    ax.set_ylim(ylim)
    ax.legend()
    ax.set_xlabel("time (ms)")
    ax.set_ylabel("db/dt")
    ax.grid(alpha=0.7)

    return ax
ax = plot_data(1, src="loop")
# ax.set_ylim(1e-15, 1)
# ax.set_xlim(1e-3, 1e1)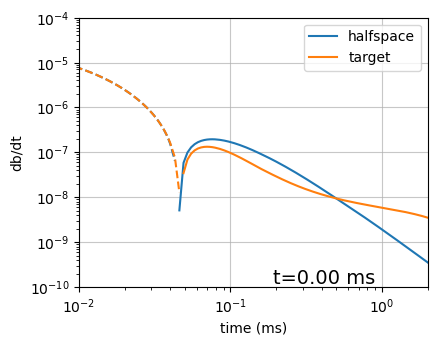
def plot_model(
    ti, key = "target", ax=None, xlim=1200*np.r_[-1, 1], zlim=np.r_[-1200, 200],
    colorbar=False, ylabels=True, vmax=None, cax=None, src="loop"
):
    if ax is None:
        fig, ax = plt.subplots(1, 1, figsize=(8, 4))

    cb = plt.colorbar(mesh.plot_slice(
        1./models[key], ax=ax,
        pcolor_opts={"norm":LogNorm(vmin=1./rho_air*1000, vmax=1./rho_layer)},
        normal="Y",
        grid=True,
        grid_opts={"color":[0.5, 0.5, 0.5], "lw": 0.5}
    )[0], ax=ax, cax=cax)
    ax.set_xlim(xlim)
    ax.set_ylim(zlim)
    ax.set_aspect(1)

    plt.tight_layout()

    cb.set_label("conductivity (S/m)")

    if src == "loop":
        ax.plot(-wire_length/2, 0, "wo", ms=6)
        ax.plot(wire_length/2, 0, "wo", ms=6)
    elif src == "wire":
        ax.plot(0, 0, "wo", ms=6)

    ax.plot(rx_y, rx_height, "ws", ms=6)


    # ax.plot(tx_radius*np.r_[-1, 1], tx_height*np.r_[1, 1], color="C1", lw=2)

    ax.text(-wire_length/2, 0+40, f"TX", fontsize=14, ha="center", color="w")
    ax.text(rx_y, rx_height+40, f"RX", fontsize=14, ha="center", color="w")

    ax.set_title("")

    ax.text(xlim.min() + 20, zlim.min() + 100, f"{rho_back} $\Omega$m", fontsize=14)
    if key =="target":
        ax.text(layer_x.min() + 20, -400, f"{rho_layer} $\Omega$m", fontsize=14)
    ax.text(xlim.min() + 20, 2, f"{rho_air:1.0e} $\Omega$m", color="w", fontsize=14)
    # ax.text(0, target_z, f"{1/sigma_target:1.0f} $\Omega$m", fontsize=14, ha="center", va="center")

    ax.set_xlim(xlim)
    ax.set_ylim(zlim)
    ax.set_aspect(1)
plot_model(0)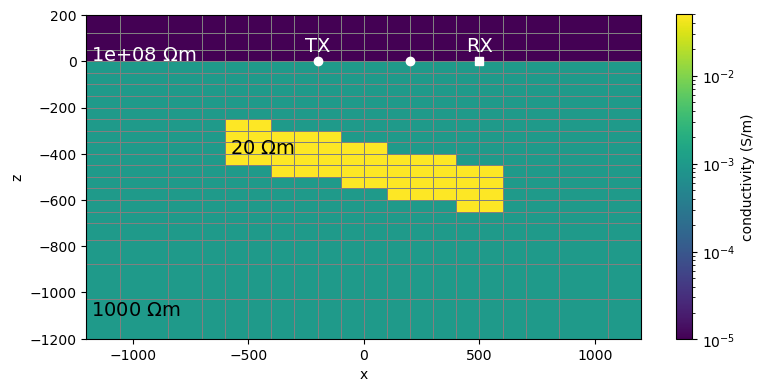
fig, ax = plt.subplots(2, 1, figsize = (7, 7.5), dpi=150)
plot_data(ax=ax[0])
plot_model(ax=ax[1], ti=0)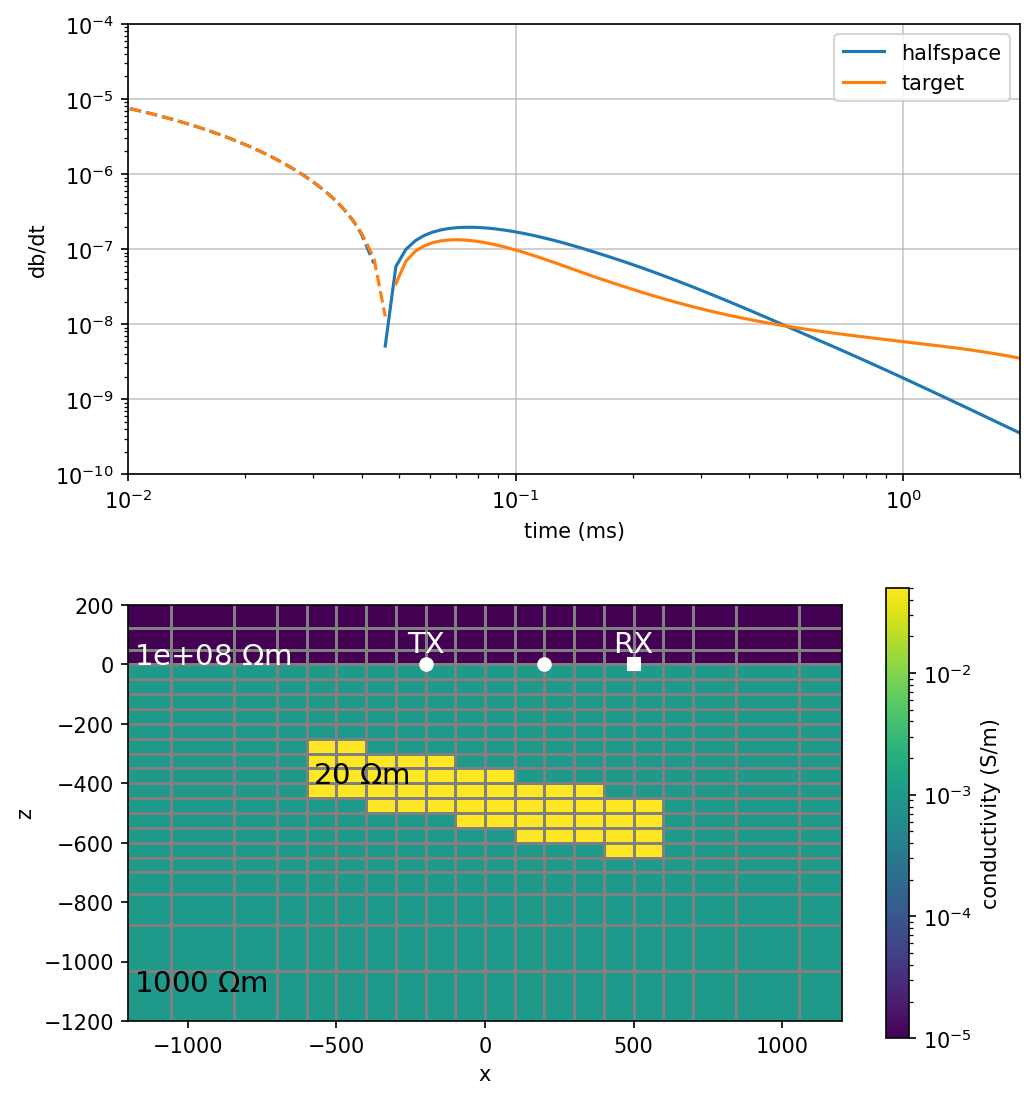
def plot_current_density(
    ti, key = "target", src="loop", ax=None, xlim=1200*np.r_[-1, 1], zlim=np.r_[-1200, 200],
    colorbar=False, ylabels=True, vmax=None, cax=None
):
    if ax is None:
        fig, ax = plt.subplots(1, 1, figsize=(4, 4))

    if src == "loop":
        jplt = (mesh.average_edge_y_to_cell * np.squeeze(fields[key][loop_src, "j", ti])[mesh.n_edges_x : np.sum(mesh.n_edges_per_direction[:2])])

        # if vmax is not None:
        vmax = np.max(np.abs(jplt))
        pcolor_opts={"norm":Normalize(vmin=-vmax, vmax=vmax), "cmap":"coolwarm"}
        # else:
        #     pcolor_opts = {"cmap":"coolwarm"}
        out = mesh.plot_slice(
            jplt, ax=ax,
            pcolor_opts=pcolor_opts,
            normal="y"
        )

#         ax.plot(-wire_length/2, 0, "ko", ms=2)
#         ax.plot(wire_length/2, 0, "ko", ms=2)

#         ax.plot(0, rx_height, "ks", ms=2)
        # ax.plot(0, 0, "ko", ms=2)

    elif src == "wire":
        src_ind = wire_src


    ax.set_xlim(xlim)
    ax.set_ylim(zlim)
    ax.set_aspect(1)

    if colorbar is True:

        cb = plt.colorbar(out[0], ax=ax, cax=cax)
        ticks = cb.get_ticks()
        cb.formatter.set_scientific(True)
        cb.formatter.set_powerlimits((0,0))

        cb.set_ticks([ticks[1], 0, ticks[-2]])
        cb.update_ticks()
        cb.set_label("current density")


    if ylabels is False:
        ax.set_ylabel("")
        ax.set_yticklabels("")

    ax.set_title("")

    return cb
def plot_dbdt(
ti, key = "target", ax=None, xlim=1200*np.r_[-1, 1], zlim=np.r_[-1200, 200],
colorbar=False, ylabels=True, vmax=1e-2, vmin=3e-10, cax=None
):
if ax is None:
fig, ax = plt.subplots(1, 1)
dbdtplt = -1 * mesh.average_face_to_cell_vector * fields[key][:, "dbdt", ti]
vmin = np.max([vmin, 1e-4*np.max(np.abs(dbdtplt))])
out = mesh.plot_slice(
dbdtplt, "CCv", view="vec", ax=ax,
pcolor_opts={"norm":LogNorm(vmin=vmin, vmax=vmax)},
range_x=xlim,
range_y=zlim,
stream_threshold=vmin,
normal="y"
)
# ax.plot(np.r_[0], tx_height, "ko", ms=2)
# ax.plot(-wire_length/2, 0, "ko", ms=2)
# ax.plot(wire_length/2, 0, "ko", ms=2)
ax.plot(rx_y, rx_height, "ws", ms=6)
ax.set_title("")
ax.set_xlim(xlim)
ax.set_ylim(zlim)
ax.set_aspect(1)
if ylabels is False:
ax.set_ylabel("")
ax.set_yticklabels("")
if colorbar is True:
cb = plt.colorbar(out[0], ax=ax, cax=cax)
cb.set_label("db/dt")plot_dbdt(120)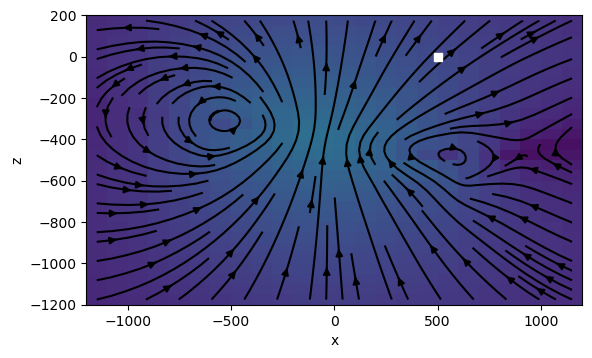
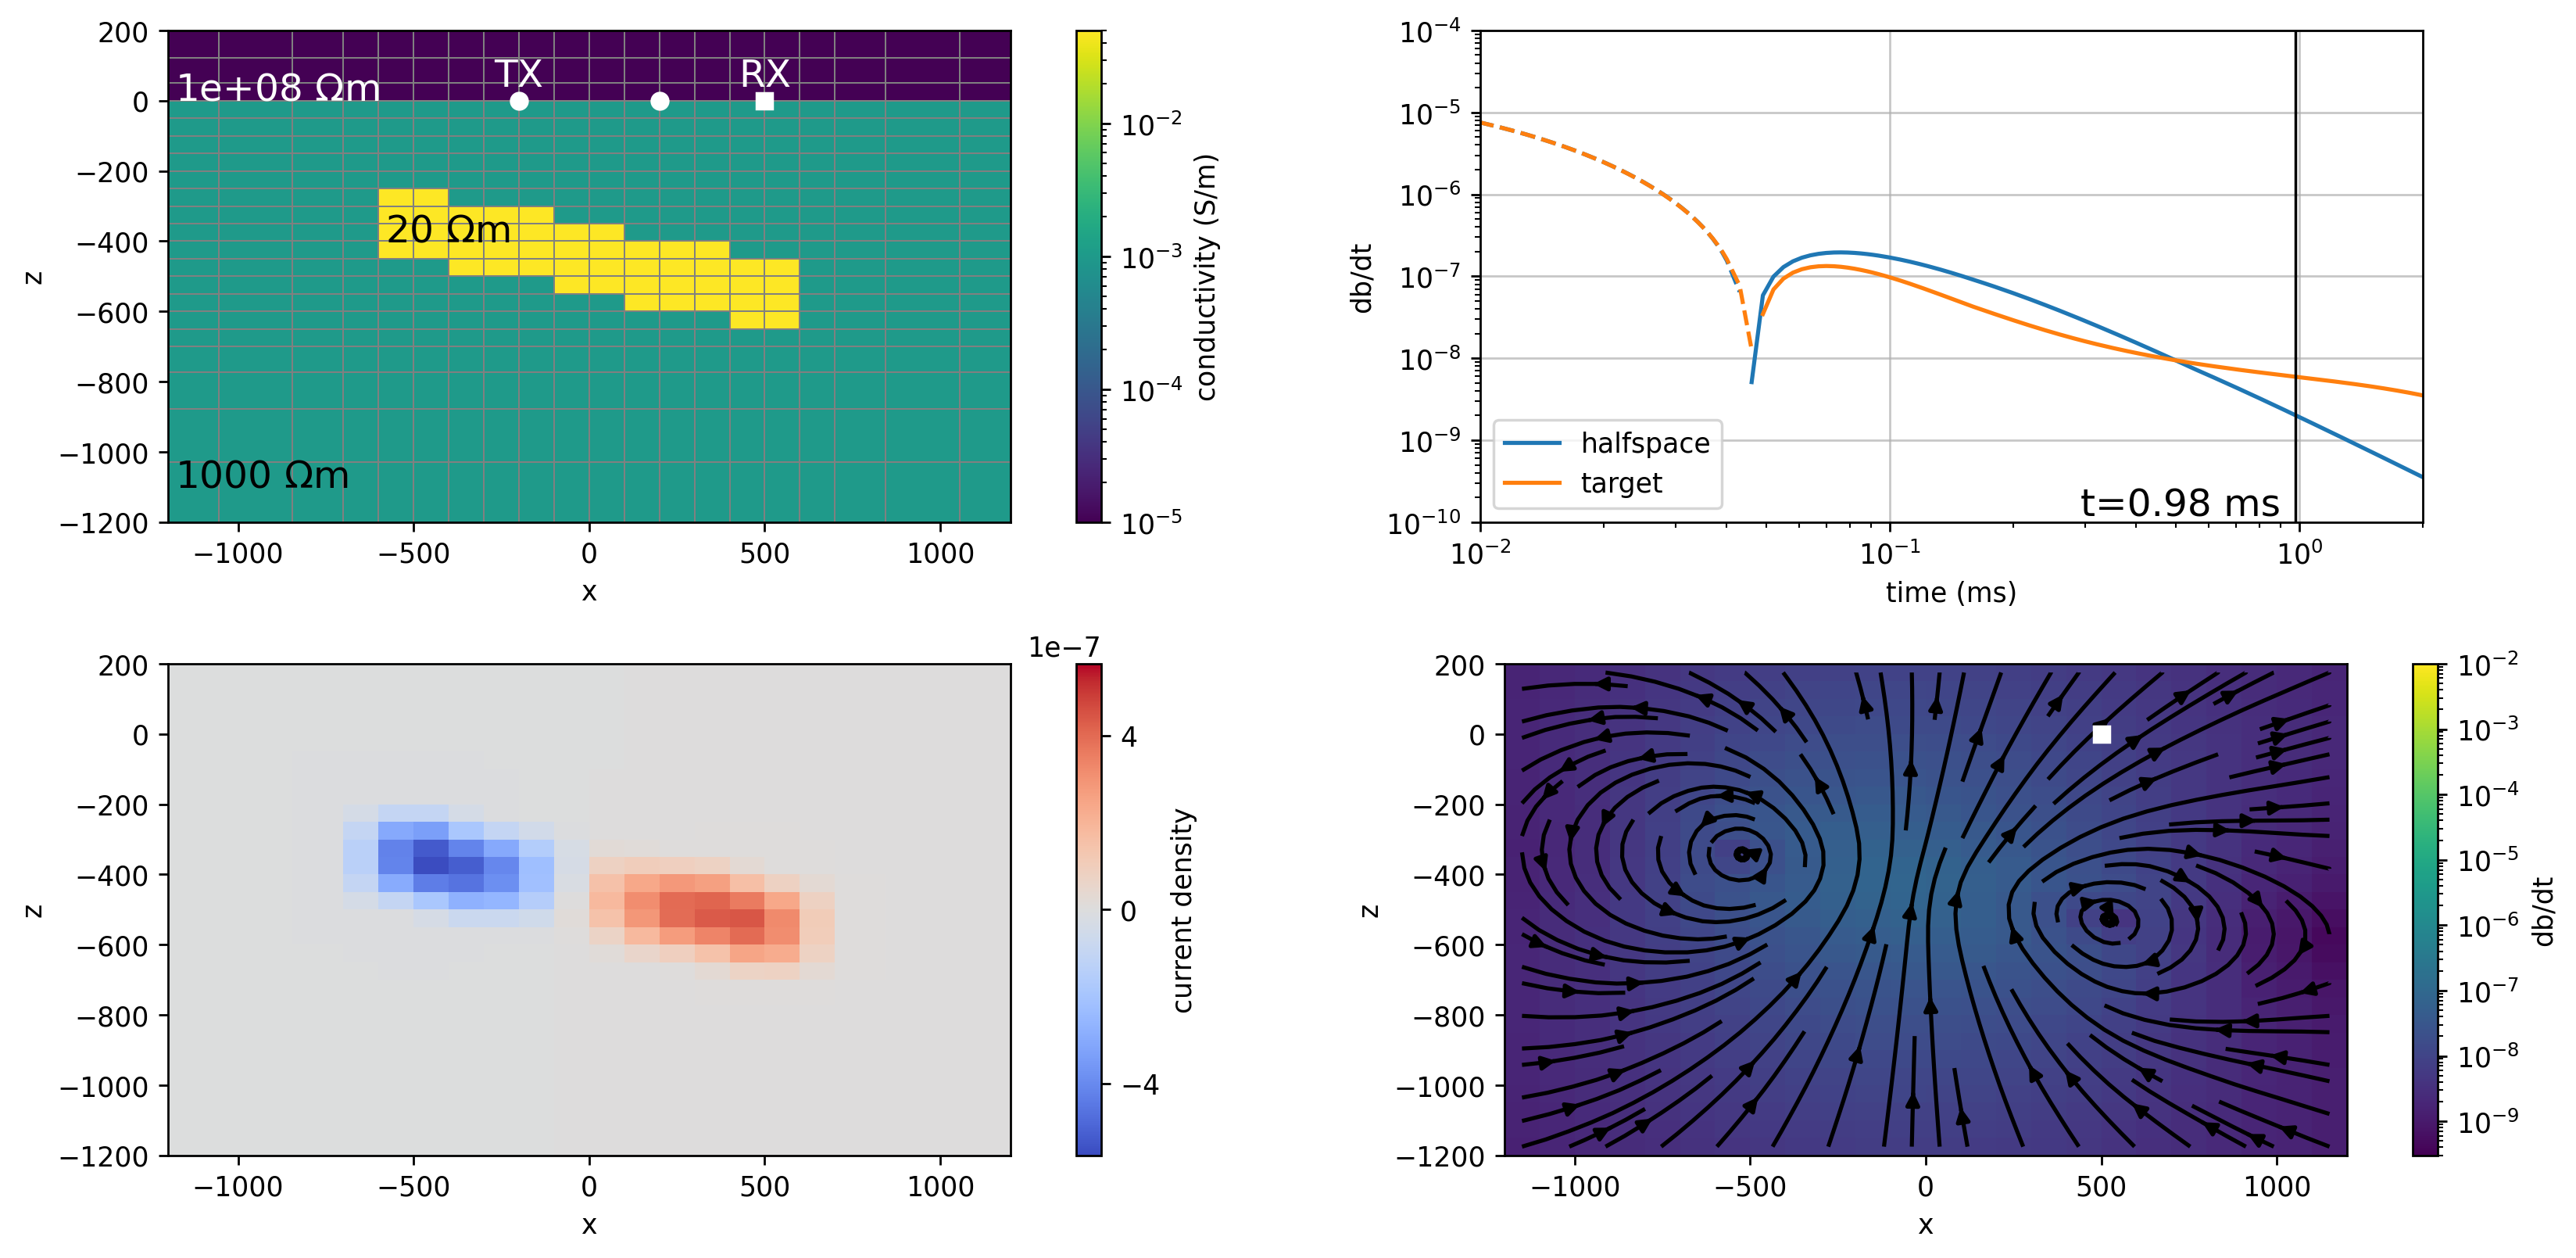
fig, ax = plt.subplots(2, 2, figsize=(14, 6.5), dpi=150)
ti = 55
plot_model(ti, ax=ax[0, 0])
plot_data(ti, ax=ax[0, 1])
plot_current_density(ti, ax=ax[1, 0], colorbar=True)
plot_dbdt(ti, ax=ax[1, 1], colorbar=True)
ax[0, 1].set_aspect(0.2)

# plt.tight_layout()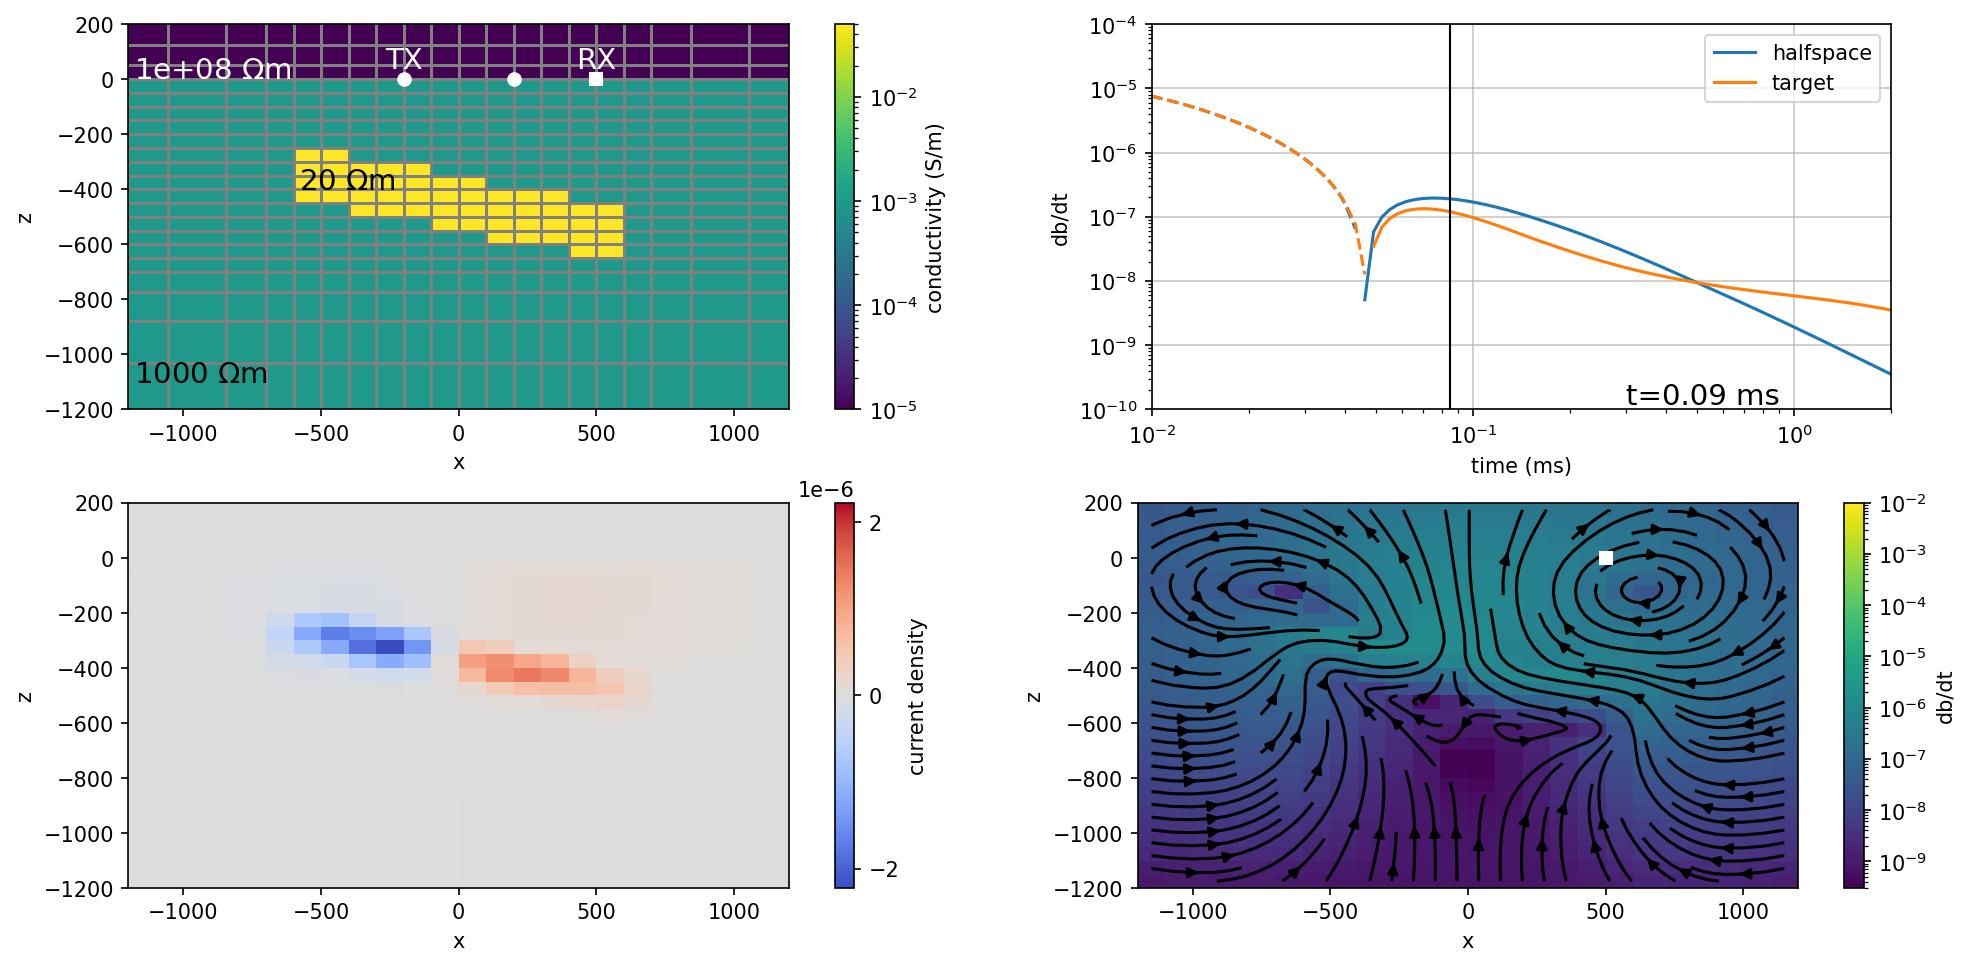
times = np.where(sim.times*1e3 < 1)[0]
ims = []
fig, ax = plt.subplots(2, 2, figsize=(14, 6.5), dpi=250)


def plotme(ti):
    for a in ax.flatten():
        a.clear()
    if len(fig.get_axes()) > 4:
        axes = fig.get_axes()
        cax = axes[-3:]
    else:
        axes = ax.flatten()
        cax = None


    plot_model(ti, ax=axes[0], colorbar=True, cax=cax[-3] if cax is not None else None)
    plot_data(ti, ax=axes[1])
    plot_current_density(ti, ax=axes[2], colorbar=True, cax=cax[-2] if cax is not None else None)
    plot_dbdt(ti, ax=axes[3], colorbar=True, cax=cax[-1] if cax is not None else None)
    axes[1].set_aspect(0.2)
    # plt.tight_layout()

    return ax

out = plotme(0)
def init():
    [o.set_array(None) for o in out if isinstance(o, collections.QuadMesh)]
    return

def update(t):
    for a in ax.flatten():
        a.clear()
    return plotme(t)

ani = animation.FuncAnimation(fig, update, times, init_func=init, blit=False)

ani.save(
    f"./dipping_inductive_video2{key}.mp4", writer="ffmpeg", fps=5, bitrate=0,
    metadata={"title":f"TDEM {key} currents", "artist":"Lindsey Heagy"}
)
times = np.where(sim.times*1e3 < 1)[0]
ims = []
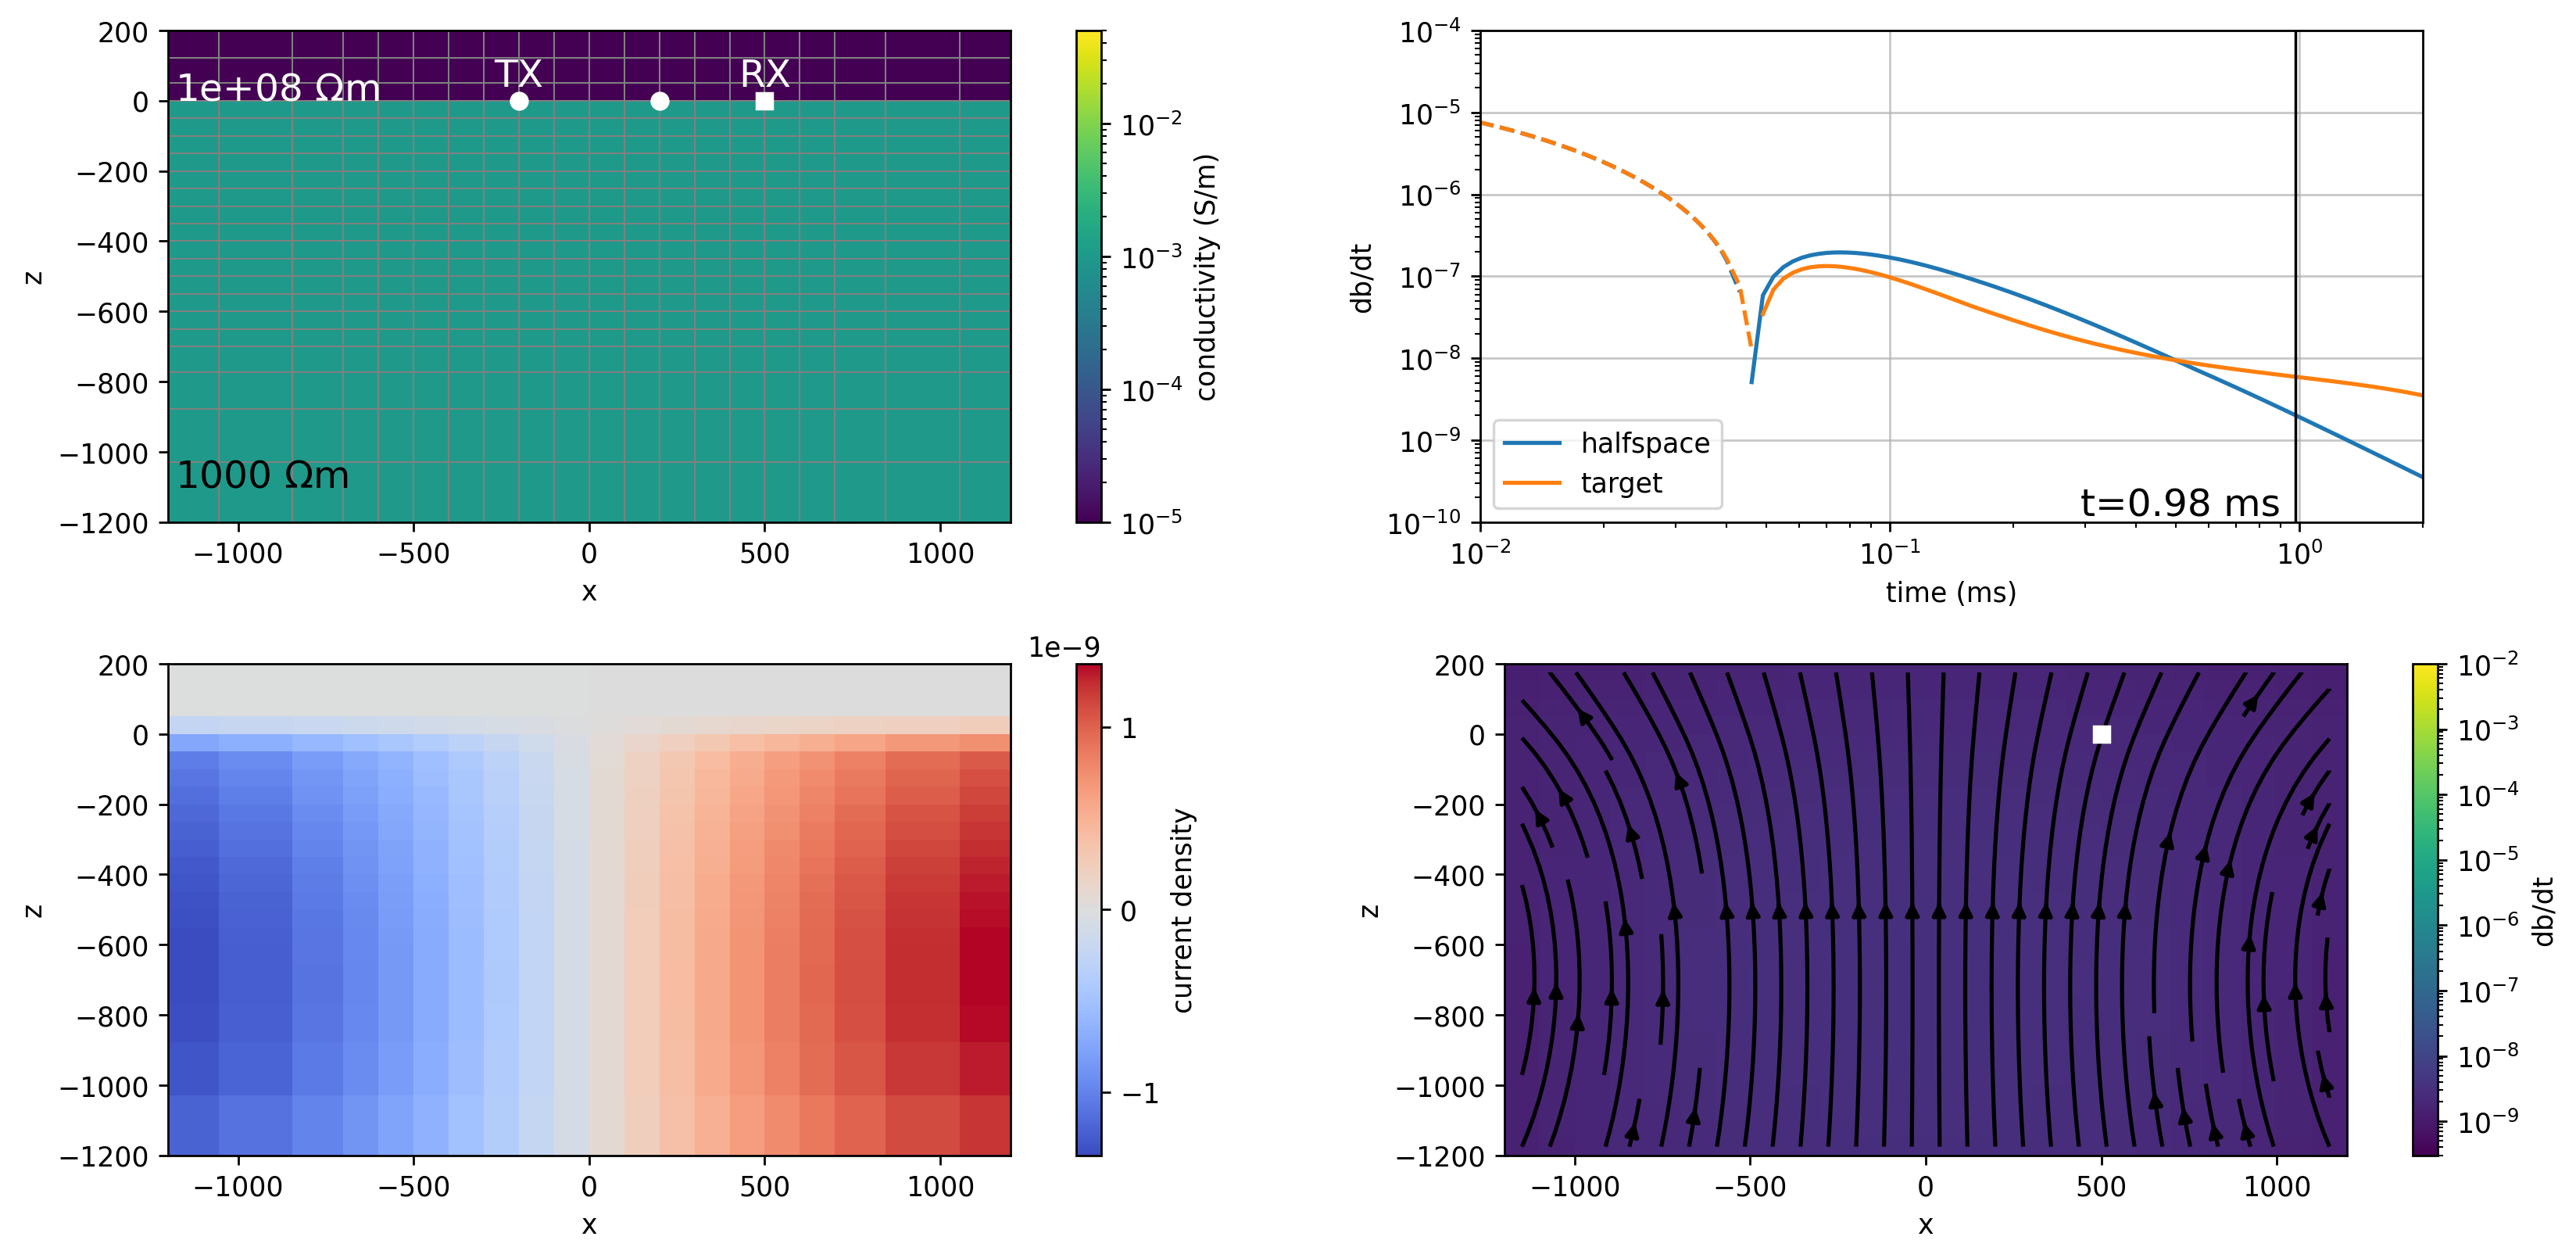
fig, ax = plt.subplots(2, 2, figsize=(14, 6.5), dpi=250)


def plotme(ti):
    for a in ax.flatten():
        a.clear()
    if len(fig.get_axes()) > 4:
        axes = fig.get_axes()
        cax = axes[-3:]
    else:
        axes = ax.flatten()
        cax = None


    plot_model(ti, key="halfspace", ax=axes[0], colorbar=True, cax=cax[-3] if cax is not None else None)
    plot_data(ti, ax=axes[1])
    plot_current_density(ti, key="halfspace", ax=axes[2], colorbar=True, cax=cax[-2] if cax is not None else None)
    plot_dbdt(ti, key="halfspace", ax=axes[3], colorbar=True, cax=cax[-1] if cax is not None else None)
    axes[1].set_aspect(0.2)
    # plt.tight_layout()

    return ax

out = plotme(0)
def init():
    [o.set_array(None) for o in out if isinstance(o, collections.QuadMesh)]
    return

def update(t):
    for a in ax.flatten():
        a.clear()
    return plotme(t)

ani = animation.FuncAnimation(fig, update, times, init_func=init, blit=False)

ani.save(
    f"./halfspace_inductive_video2{key}.mp4", writer="ffmpeg", fps=3, bitrate=0,
    metadata={"title":f"TDEM {key} currents", "artist":"Lindsey Heagy"}
)
Report()
--------------------------------------------------------------------------------
  Date: Sat Jan 25 12:22:51 2025 PST

                OS : Darwin (macOS 13.6.6)
            CPU(s) : 12
           Machine : arm64
      Architecture : 64bit
               RAM : 64.0 GiB
       Environment : Jupyter
       File system : apfs

  Python 3.11.10 | packaged by conda-forge | (main, Oct 16 2024, 01:26:25)
  [Clang 17.0.6 ]

            simpeg : 0.22.2.dev41+ge21040475
        discretize : 0.11.0
       pymatsolver : 0.3.1
             numpy : 2.0.0
             scipy : 1.14.1
        matplotlib : 3.9.2
            geoana : 0.7.2
            libdlf : 0.3.0
            cython : 3.0.11
             numba : 0.60.0
           sklearn : 1.5.2
            pandas : 2.2.3
             sympy : 1.13.3
           IPython : 8.29.0
        ipywidgets : 8.1.5
            plotly : 5.24.1
--------------------------------------------------------------------------------